


The Art of Survival
The Pioneering Infographics of Japan’s WWII Defense Efforts

As World War II raged on, the skies over Japan became increasingly dangerous. Air raids by the United States Armed Forces began on a large scale in mid-1944, escalating in scope and intensity as the war drew to a close.
For Japanese civilians, understanding how to protect themselves from these relentless aerial assaults was a matter of life and death. To aid in this effort, the Japanese government produced the 国民防空図譜 (Kokumin Boku Zufu), or National Air Defense Maps. (1944).
The aesthetic appeal of these maps is striking. They combine functional precision with a visual clarity that makes them easy to understand, even in moments of panic. The maps were distributed widely, becoming an essential part of daily life for many Japanese citizens during the war.
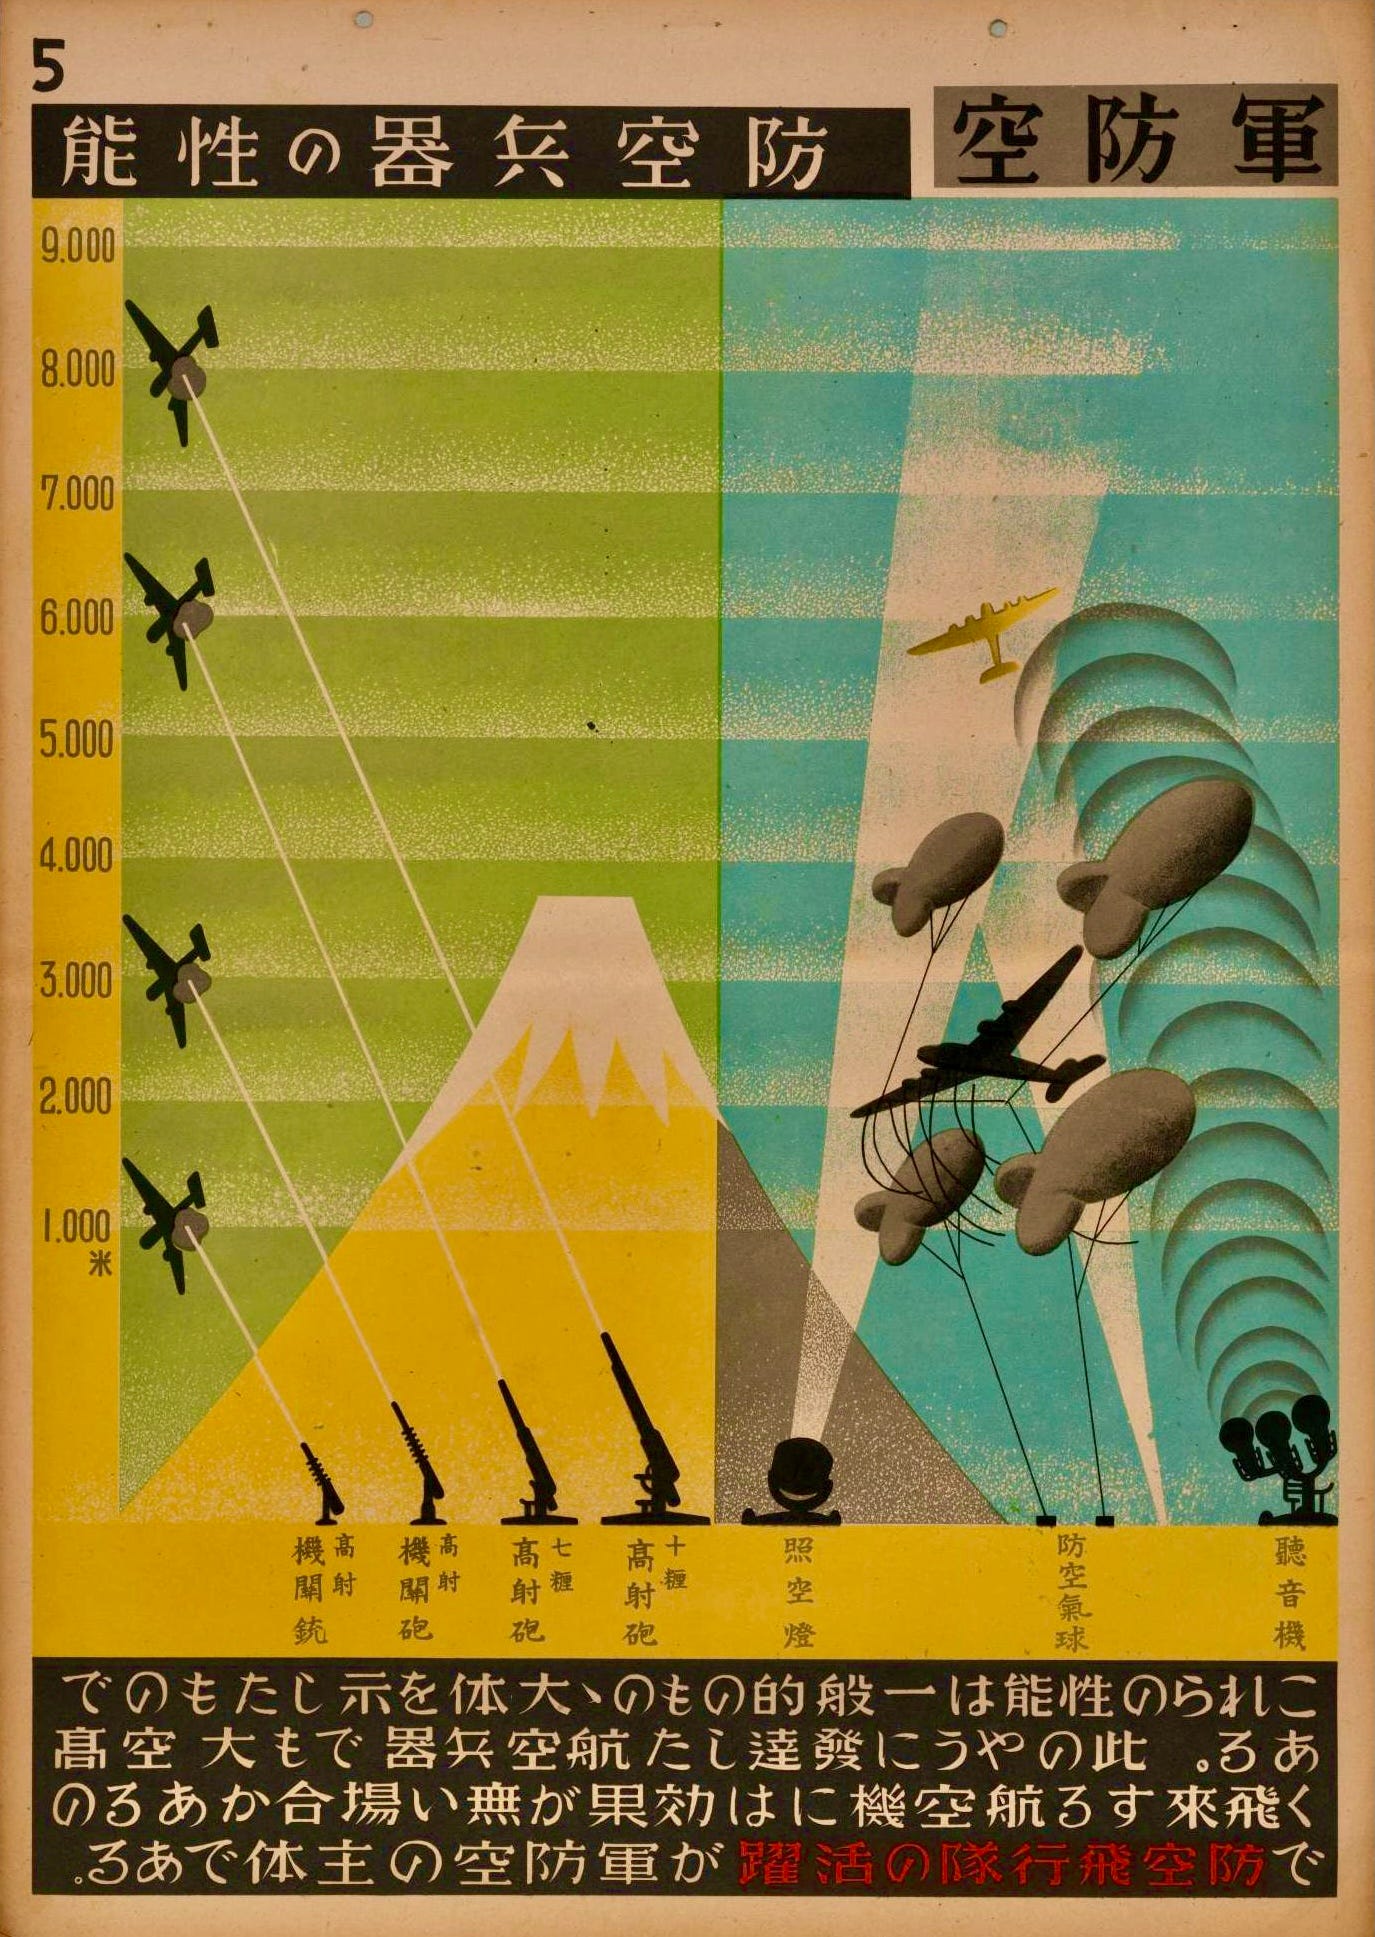
Plate 5: Air Defenses (above)
This illustration details anti-aircraft defenses employed to protect Japanese airspace - showing anti-aircraft artillery and military balloons arrayed in a layered defense strategy. The vertical scale on the left indicates the altitude of approaching enemy aircraft, while the lines and angles depict the effective range of each weapon.
Mount Fuji used as iconic reference point.
The strategic importance of different weapons targeting planes at various altitudes.
Defensive balloons are highlighted as barriers against low-flying aircraft.
Plate 7: Early Warning Network
This diagram illustrates the extensive network of observation posts and communication lines vital for coordinating air defense. The interconnected nodes represent various observation points, each relaying critical information through telephone and wireless communication channels.
The text outlines the roles of different observation stations and the flow of information.
The diagram emphasizes the need for quick and efficient communication to coordinate defenses effectively.
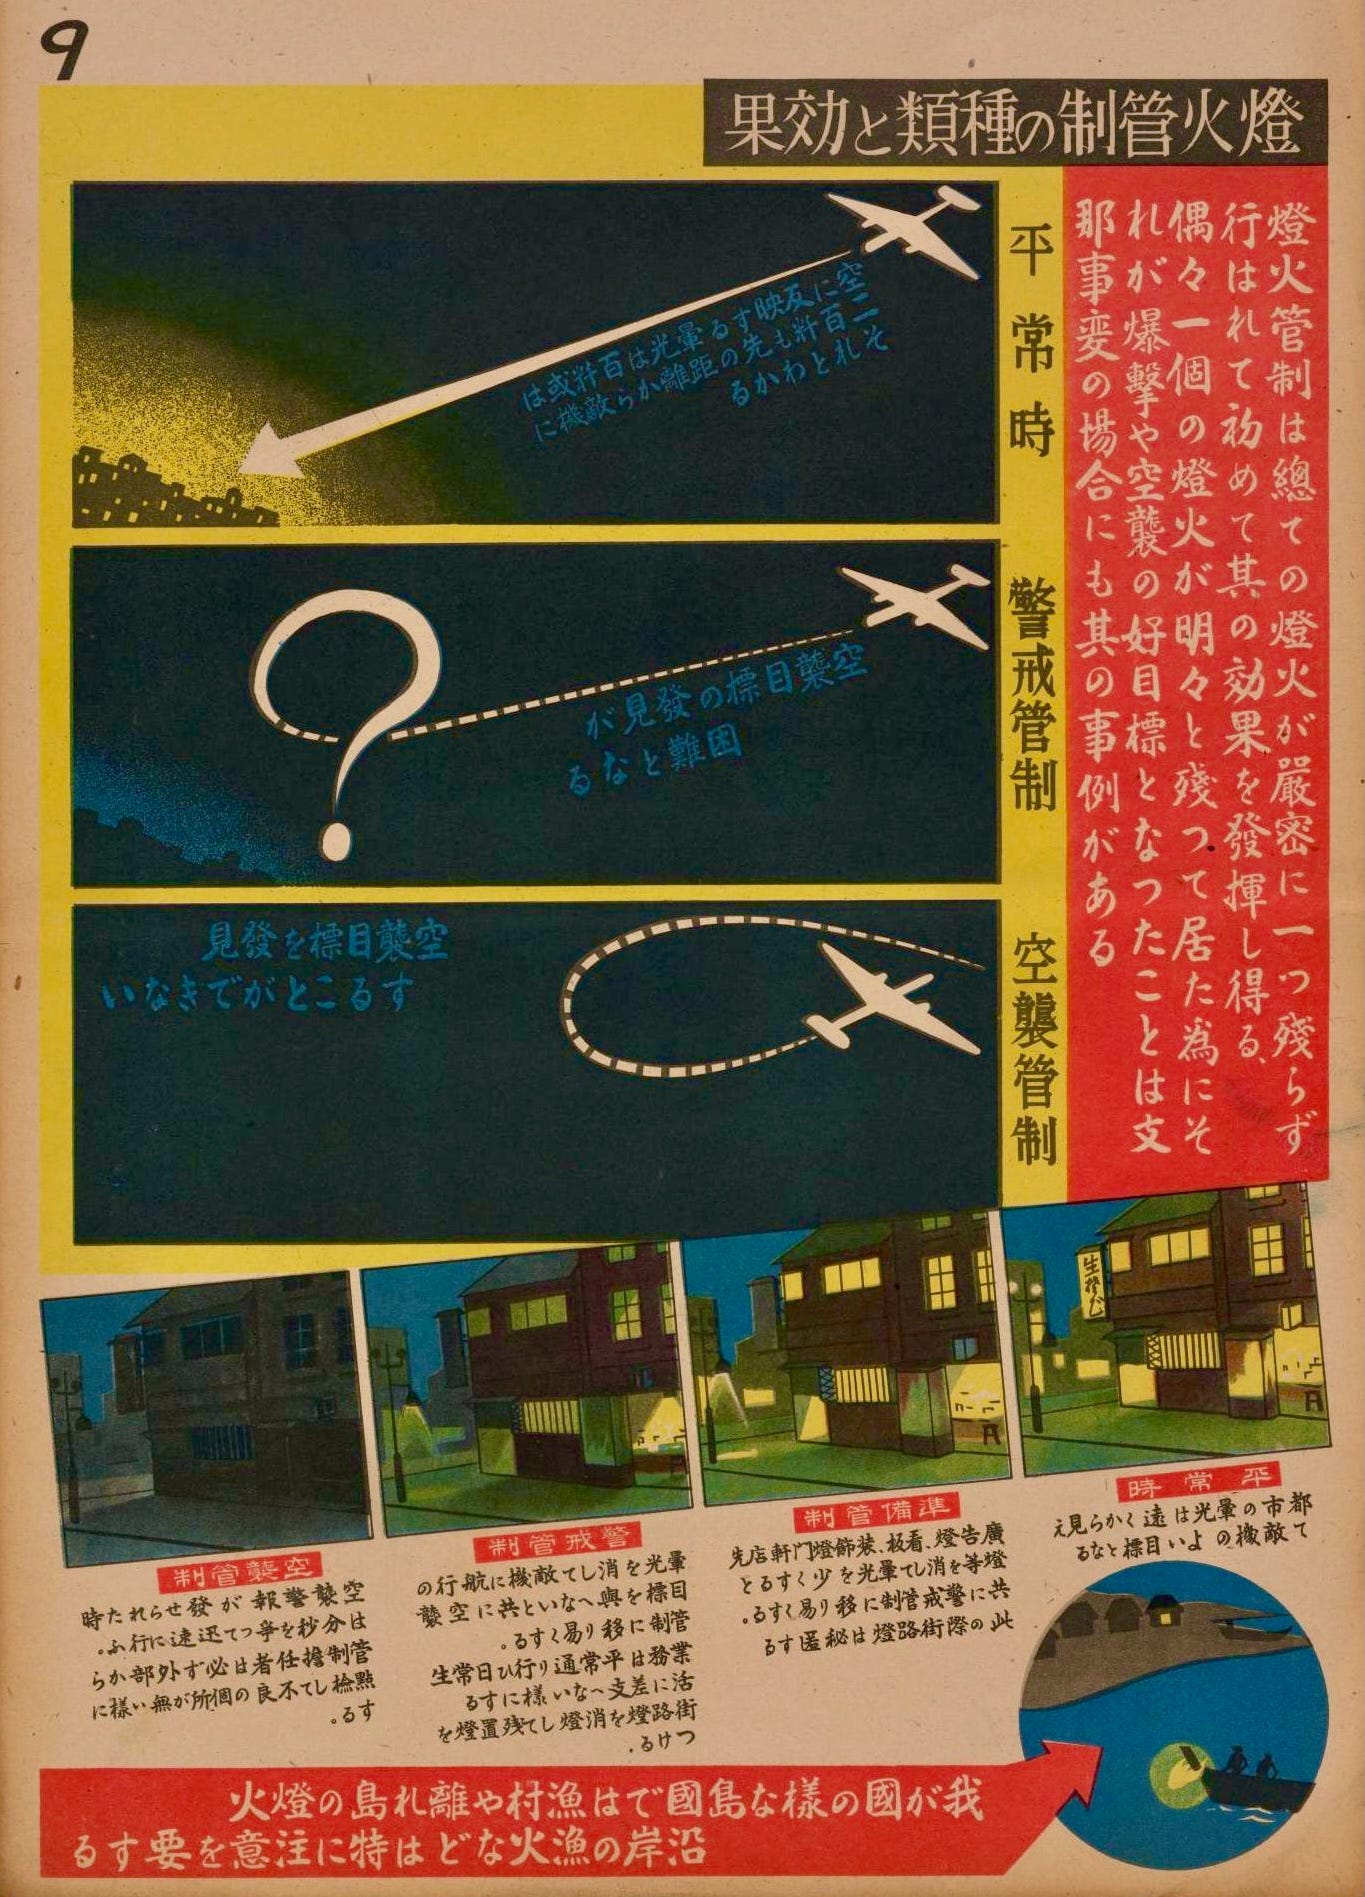
Plate 9: Blackouts Save Lives
Graphics serve as a guide for civilians for blackout procedures to avoid detection by enemy aircraft. A dramatic “?” graphically demonstrates how “lights out” protects civilians.
The text explains the importance of blackout measures and how to implement them.
Methods for restricting lighting - houselights, blackout windows and streetlights.
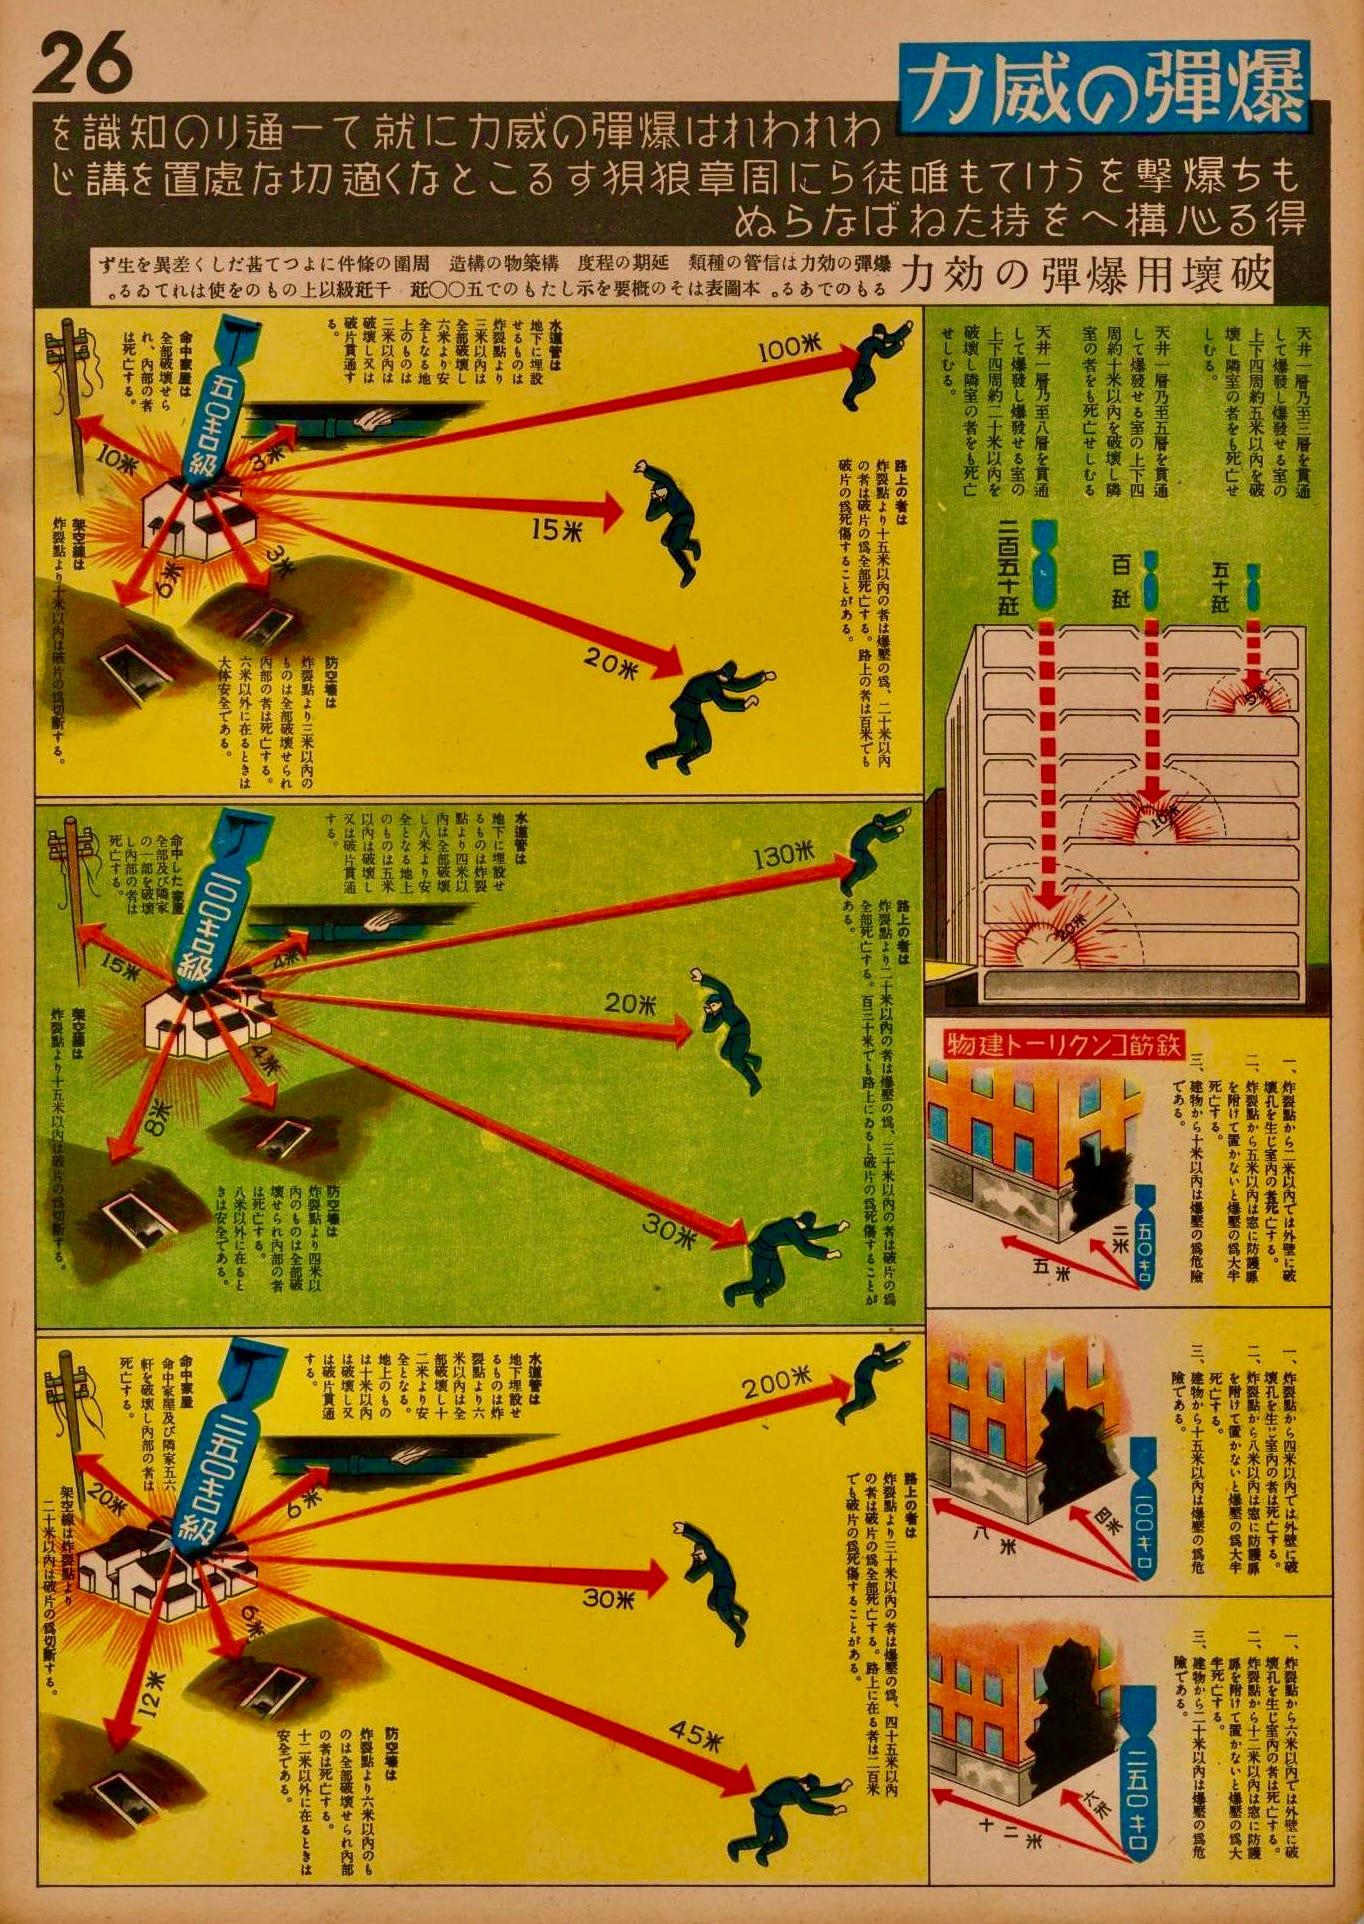
Plate 26: Impact of Bombing
These detailed diagrams show the effects of bomb explosions, illustrating the blast radius and potential damage to structures and individuals. Visuals illustrate the destructive power of bombs and the importance of maintaining a safe distance.
Describes the varying impacts of bombs based on their size and proximity to the explosion.
Different levels of damage are depicted, providing a clear understanding of the risks involved.
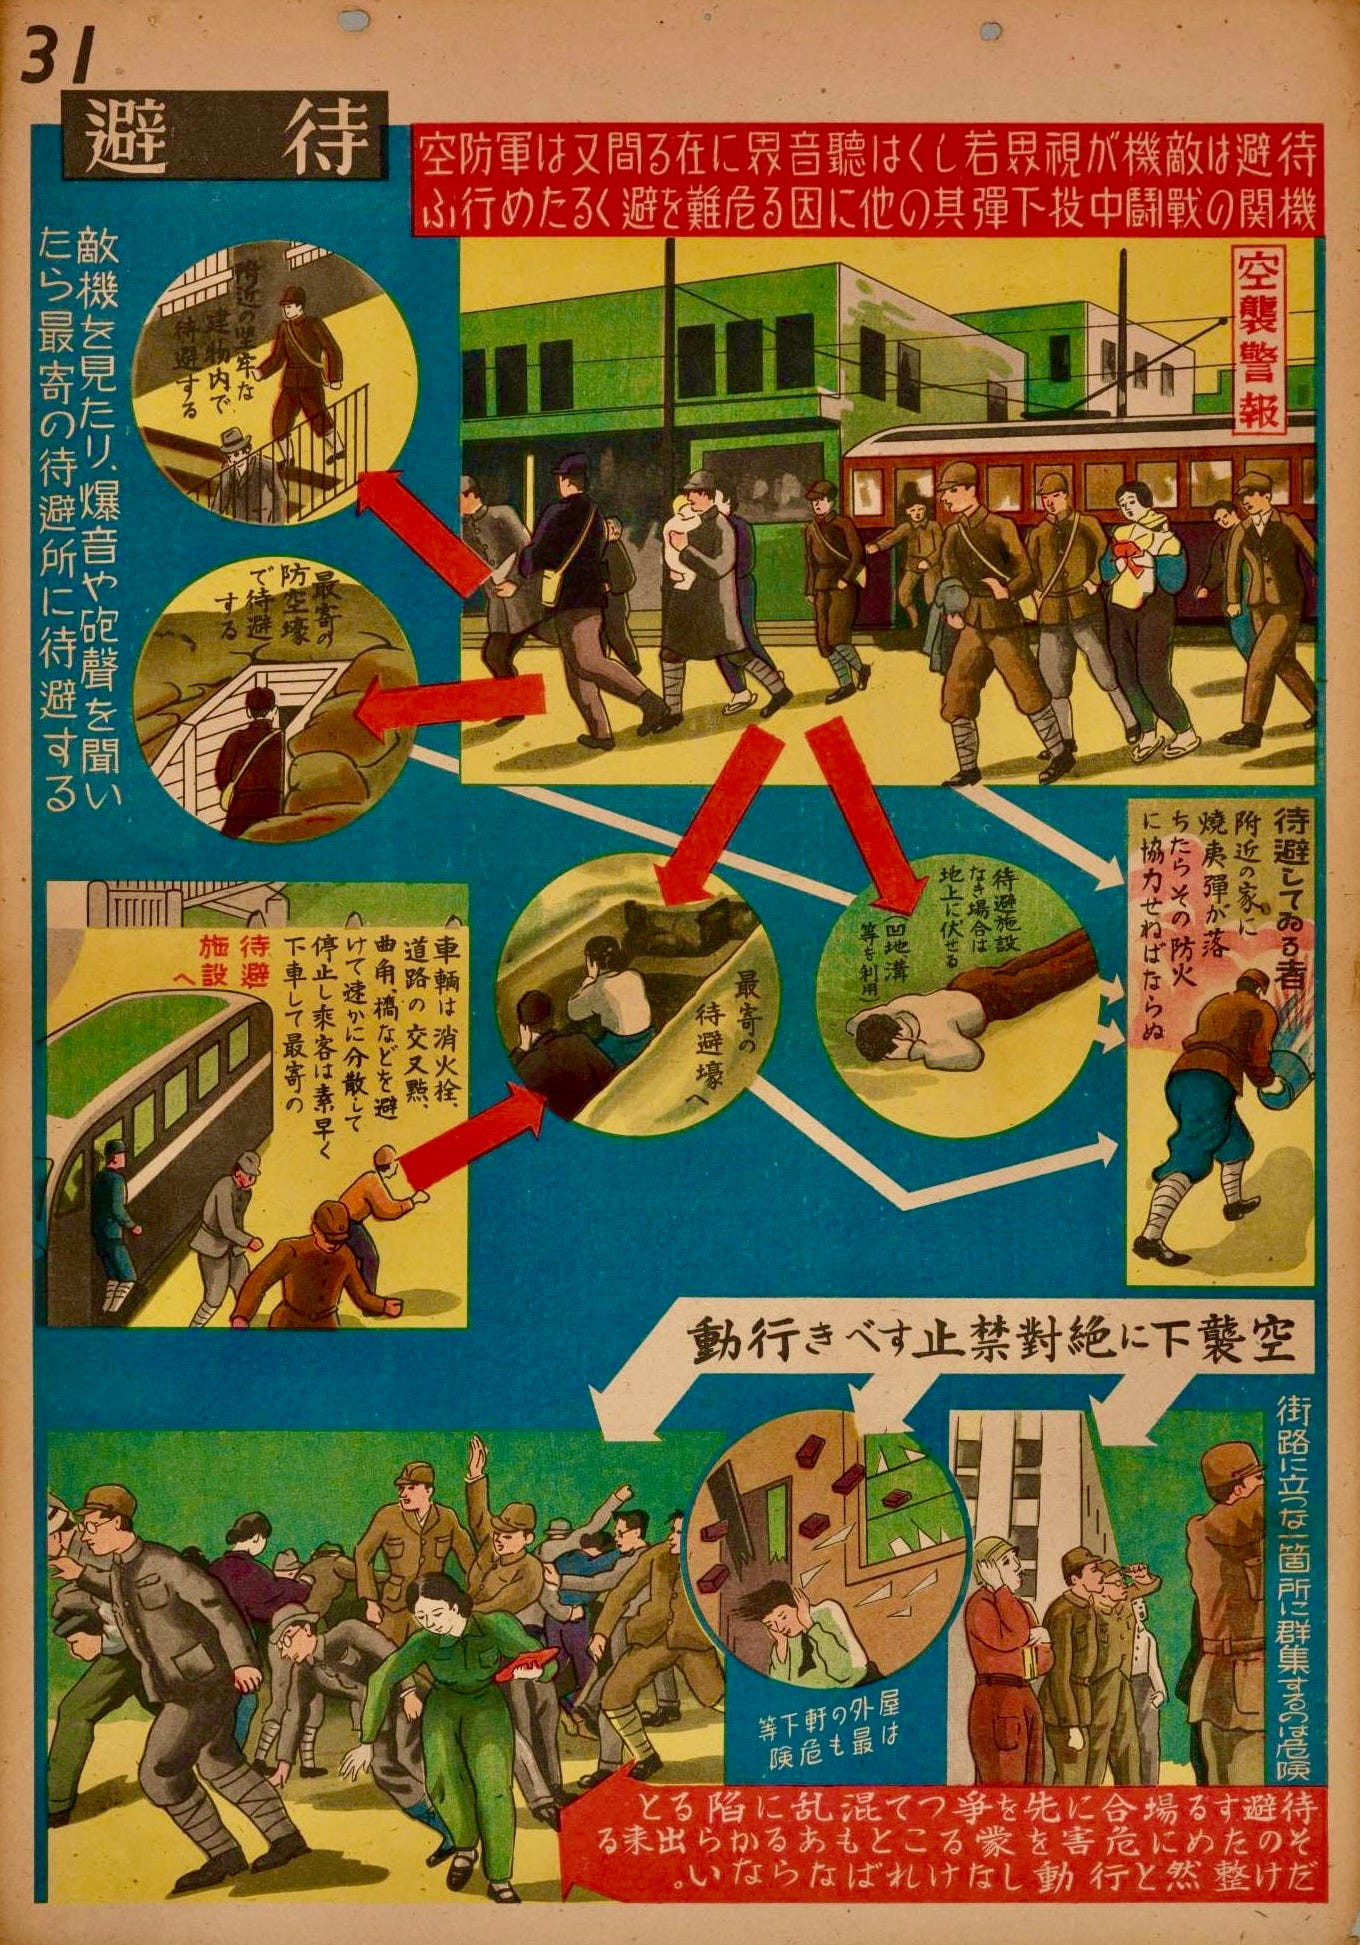
Plate 31: Evacuation and Shelter
Provides guidance on evacuation procedures and sheltering techniques during air raids. It visually instructs civilians on where to go and how to protect themselves, emphasizing the importance of quick and orderly movement to safety.
The text provides instructions on finding the nearest shelter and stresses the importance of staying calm and following directions.
Visual cues depict various scenarios, such as evacuating from buildings and utilizing public shelters.
The Kokumin Boku Zufu illustrations are more than just wartime artifacts; they are historical examples of the power of visual communication. They distilled complex defense strategies and safety measures into clear, understandable visuals for the general public. In doing so, they ensured that the masses could grasp essential information quickly and act accordingly.
Today, we see their legacy in modern infographics. Whether it’s for public health campaigns, emergency preparedness, or educational purposes, infographics break down complex data into digestible visuals.
From the author’s collection. Photographed at Shinkansen station in Kyoto.
Source - National Air Defense Maps: National Diet Library of Japan - Digital Archives
Another version of the set is found at David Rumsey Map Collection
Hat Tip to Bill Chapman / Classroom Tools
More Japanese maps
Manga, Satire, and Propaganda

In 1932, as Japan’s imperial ambitions were on the rise, an exceptional satirical world map was created by Shishido Sako - a Japanese manga pioneer. High resolution image His perspective was shaped by the nine years he spent in the US, beginning in 1912.
Teaching Japanese Children to Support WWII (1940)

Atlantic view: This map is from a magazine published in Japan as part of the effort to engage and mobilize school children for the war effort. Germany's conquests are shown along the bottom from right to left: Poland, Denmark, Holland, Belgium, Norway, France - and then England with a question mark!
Wonderful share Peter; Thank you.
These are so fantastic! I love the way you put these visually stunning infographics into context.