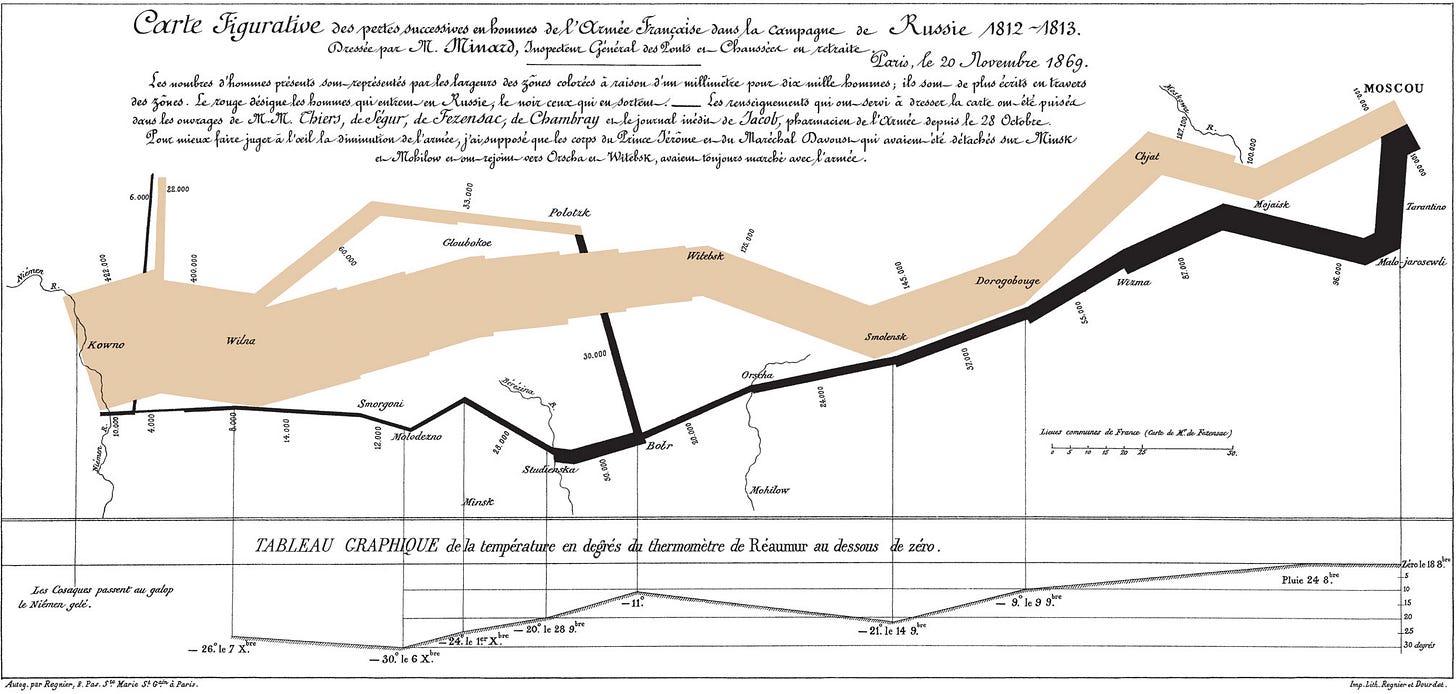
Charles Minard's map of Napoleon's disastrous Russian campaign of 1812. The skillfully designed chart details the human tragedy of Napoleon's folly. The Grand Army left Poland with over 400,000 troops. Only 100,000 reached Moscow. Barely 10,000 limped back in defeat.
Edward Tufte, dataviz guru and author of the acclaimed, “The Visual Display of Quantitative Information,” calls Minard's map “the best statistical graphic ever drawn”. Link
The illustration depicts Napoleon's army departing the Polish-Russian border. A thick band illustrates the size of his army at specific geographic points during their advance to Moscow (tan) and retreat (black).
Scroll down for an English version of the map.
It displays six types of data in two dimensions, without making mention of Napoleon; Minard's interest lay with the travails and sacrifices of the soldiers.
the number of Napoleon's troops
the distance traveled
temperature
latitude and longitude
direction of travel
location relative to specific dates
Charles Joseph Minard was a French civil engineer recognized for his significant contribution in the field of information graphics in civil engineering and statistics. Minard was, among other things, noted for his representation of numerical data on geographic maps, especially his flow maps.
Minard is best known for his cartographic depiction of numerical data on a map of Napoleon's disastrous losses suffered during the Russian campaign of 1812 (in French, Carte figurative des pertes successives en hommes de l'Armée Française dans la campagne de Russie 1812–1813). He created it at age 80 (in 1861) building on a career of developing innovative techniques to display data.
The original description in French accompanying the map translated to English:
Figurative Map of the successive losses in men of the French Army in the Russian campaign 1812–1813.
Drawn by M. Minard, Inspector General of Bridges and Roads (retired). Paris, November 20, 1869.
The numbers of men present are represented by the widths of the colored zones at a rate of one millimeter for every ten thousand men; they are further written across the zones. The red designates the men who enter Russia, the black those who leave it. — The information which has served to draw up the map has been extracted from the works of M. M. Thiers, de Ségur, de Fezensac, de Chambray and the unpublished diary of Jacob, the pharmacist of the Army since October 28th.In order to better judge with the eye the diminution of the army, I have assumed that the troops of Prince Jérôme and of Marshal Davout, who had been detached at Minsk and Mogilev and have rejoined near Orsha and Vitebsk, had always marched with the army.
For a more detailed analysis of Menard’s Map see: “Dataviz History: Charles Minard’s Flow Map of Napoleon’s Russian Campaign of 1812 part-5.”
Hat Tip to
. Our chat about attending Tufte’s seminars inspired this post


I'd like to see one of those for Putin's Ukraine campaign.